[Rust] CPU 성능 프로파일링: flamegraph
flamegraph는 perf 기반의 성능 프로파일링을 위한 그래프 도구다.
어떤 함수가 CPU 리소스를 얼마나 점유했는지 등을 가시화해서 성능 최적화에 도움을 주는 용도다.
메모리 프로파일링은 이걸로 안되는거같다.
사전 조건
먼저 linux kernel 측정 도구인 perf가 깔려있어야 한다. 아래 포스트를 참고한다.
https://blog.naver.com/sssang97/223140670513
그리고 몇가지 보안 수준 옵션을 좀 조절해줘야 한다.
아래 옵션을 -1로 깔아서 다 열어주고
sudo sysctl kernel.perf_event_paranoid=-1
이것도 풀어준다.
echo 0 | sudo tee /proc/sys/kernel/kptr_restrict
CLI 설치
cargo install을 통해 설치한다.
cargo install flamegraph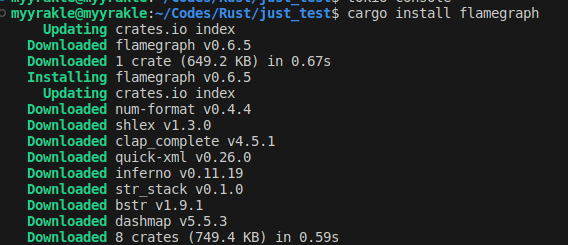 이거면 된다.
기본 사용법
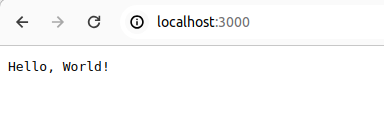
먼저 성능 측정을 위한 간단한 서버를 작성해봤다.
[dependencies]
axum = "0.7.4"
tokio = { versopm = "1", features = ["full"] }

[profile.release]
debug = true
use axum::{routing::get, Router};
#[tokio::main]
async fn main() {
// build our application with a route
let app = Router::new()
.route("/", get(root))
.route("/eat-cpu", get(eat_cpu));
// run our app with hyper, listening globally on port 3000
let listener = tokio::net::TcpListener::bind("0.0.0.0:3000").await.unwrap();
axum::serve(listener, app).await.unwrap();
}
// basic handler that responds with a static string
async fn root() -> &'static str {
"Hello, World!"
}
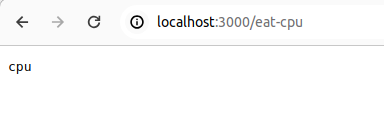
async fn eat_cpu() -> &'static str {
let mut hash_set = std::collections::HashSet::new();
for i in 0..1000000 {
hash_set.insert(i);
}
"cpu"
}그냥 간단한 API 하나와 cpu에 부하를 주는 API 하나만 뒀다.
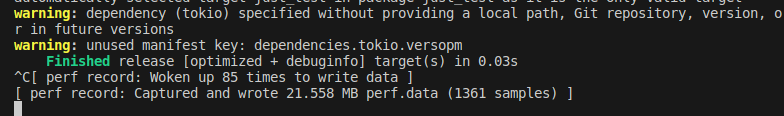
그리고 cargo flamegraph 명령을 통해서 코드를 실행한다.
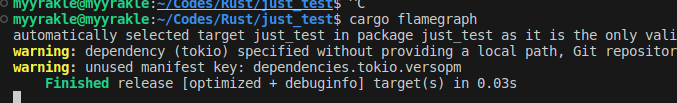 이 명령은 내부적으로 cargo run을 돌려서 프로젝트를 실행한다.
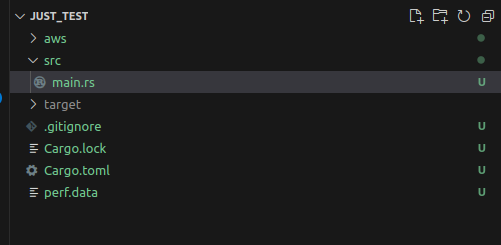
그러면 perf.data 프로파일 데이터가 쌓일 것이다.
이 상태에서 적절히 부하를 주면서 테스트를 해본다.
테스트를 충분히 했다면 프로그램을 종료한다.
그러면 프로젝트 루트 디렉터리에 가시화한 svg 이미지 파일이 export 되는데
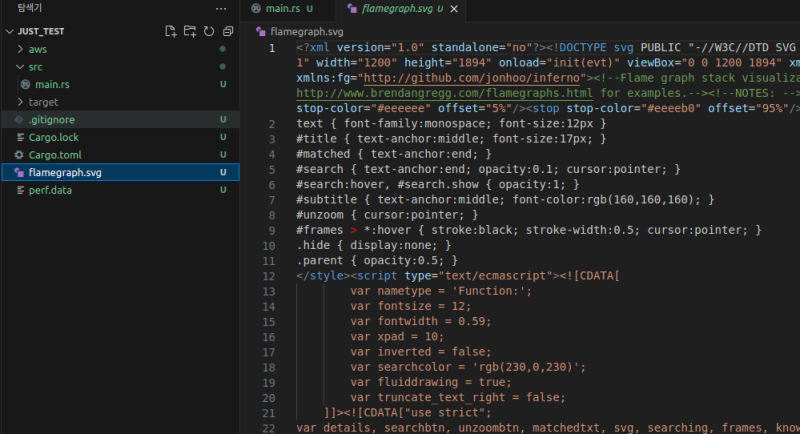
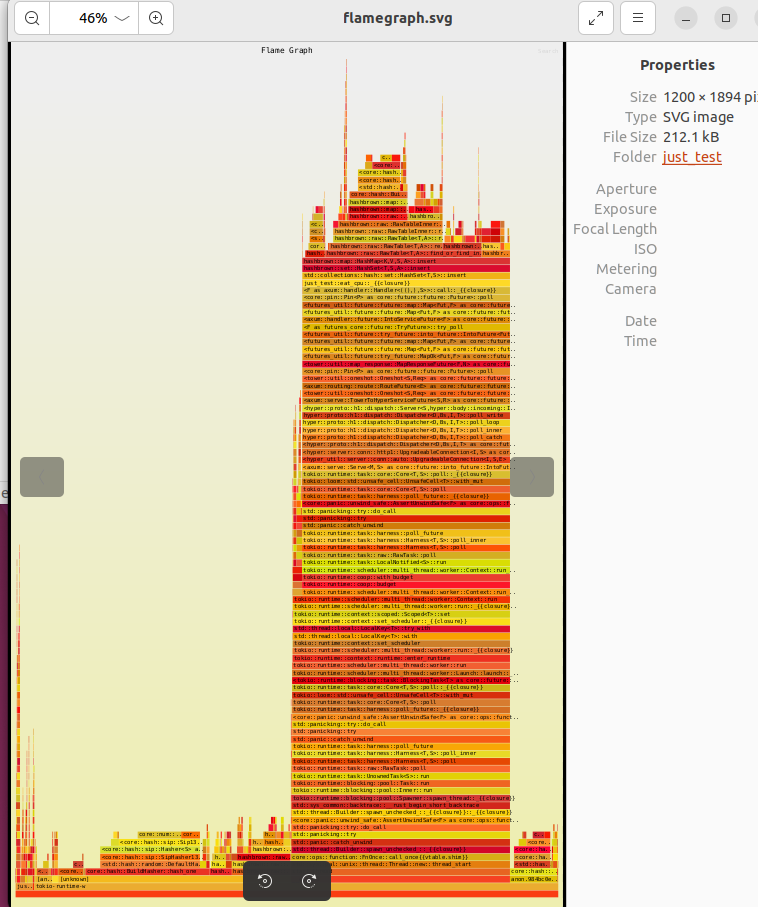 이걸 통해서 실제 사용량을 가늠해볼 수 있는 것이다. 당연히 크고 높을 수록 영향도가 높다.
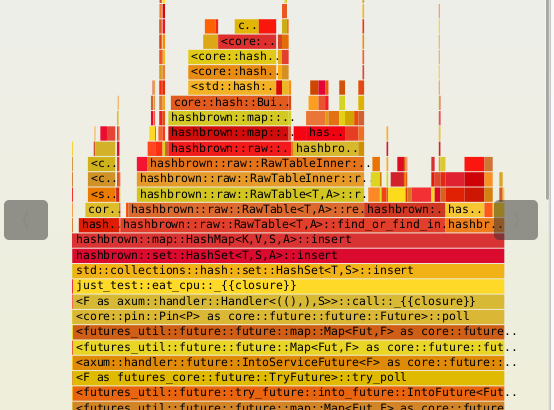 자세히 확대해서 보면 대부분의 부하가 eat_cpu 호출 스택에 모여있는 것을 볼 수 있다.
이렇게 쫓아가면서 추적하고 최적화를 시작하면 된다.
참조
https://github.com/flamegraph-rs/flamegraph
https://stackoverflow.com/questions/21284906/perf-couldnt-record-kernel-reference-relocation-symbol