[Rust] memory 프로파일링: with jemalloc
Rust에서 메모리 추적을 달성할 수 있는 몇가지 방법 중 하나가 jemalloc 할당 기능을 이용하는 것이다.
왜나면, jemalloc은 자체적으로 memory 추적 기능을 제공하기 때문이다.
이 방법은 거의 linux, mac 환경에서만 사용할 수 있다. windows에서는 조금 불편할 것이다.
jemalloc 기본 구성
먼저 jemalloc을 사용할 수 있게끔 할당자를 구성해줘야 한다.
적절한 래퍼 crate를 하나 추가해준다.
tikv-jemallocator = { version = "0.5.4", features = ["profiling", "unprefixed_malloc_on_supported_platforms"] }
가장 먼저 전역변수 구성을 통해 기본 할당자를 바꿔준다.
#[cfg(not(target_env = "msvc"))]
#[global_allocator]
static ALLOC: tikv_jemallocator::Jemalloc = tikv_jemallocator::Jemalloc;
이거만 해도 자동으로 jemalloc을 통해 할당을 하게 된다.
이번에는 프로파일 설정을 켜보자. 이것도 전역변수 방출을 통해 이뤄진다.
#[allow(non_upper_case_globals)]
#[export_name = "malloc_conf"]
pub static malloc_conf: &[u8] =
    b"prof:true,prof_active:true,lg_prof_sample:29,lg_prof_interval:30\0";
malloc_conf라는 전역변수를 방출하면 jemalloc이 가져다가 쓰는 것이다.
지정한 옵션의 의미는 대략 이렇다.
- prof:true,prof_active:true는 둘다 프로파일링을 활성화하겠다는 의미를 가진다. prof_active는 즉각적인 활성화/비활성화 제어를 위해 존재한다.
- lg_prof_sample:29는 이건.. 뭐라고 하지? 측정되는 샘플 간의 간격을 뜻한다. 크기가 커질수록 성능 오버헤드가 줄어들지만 프로파일 정확도도 내려간다.
- lg_prof_interval:30는 1GB(2^30) 단위가 할당될때마다 덤프를 하겠다는 뜻이다.
자세한 것은 문서를 참고한다.
https://linux.die.net/man/3/jemalloc
아래는 예제 코드다.
[package]
name = "just_test"
version = "0.1.0"
edition = "2021"

# See more keys and their definitions at https://doc.rust-lang.org/cargo/reference/manifest.html

[dependencies]
axum = "0.7.4"
tokio = { versopm = "1", features = ["full"] }
tikv-jemallocator = { version = "0.5.4", features = ["profiling", "unprefixed_malloc_on_supported_platforms"] }
use std::thread;
use axum::{http::StatusCode, response::IntoResponse, routing::get, Router};
#[cfg(not(target_env = "msvc"))]
#[global_allocator]
static ALLOC: tikv_jemallocator::Jemalloc = tikv_jemallocator::Jemalloc;
#[allow(non_upper_case_globals)]
#[export_name = "malloc_conf"]
pub static malloc_conf: &[u8] =
b"prof:true,prof_active:true,lg_prof_sample:29,lg_prof_interval:30\0";
#[tokio::main]
async fn main() {
// build our application with a route
let app = Router::new()
.route("/", get(root))
.route("/eat-cpu", get(eat_cpu))
.route("/eat-memory", get(eat_memory));
// run our app with hyper, listening globally on port 3000
let listener = tokio::net::TcpListener::bind("0.0.0.0:3000").await.unwrap();
axum::serve(listener, app).await.unwrap();
}
// basic handler that responds with a static string
async fn root() -> &'static str {
"Hello, World!"
}
async fn eat_cpu() -> &'static str {
let mut hash_set = std::collections::HashSet::new();
for i in 0..1000000 {
hash_set.insert(i);
}
"cpu"
}
async fn eat_memory() -> &'static str {
let mut v: Vec<i32> = Vec::new();
// 200mb of memory
for i in 0..50_000_000 {
v.push(i);
}
"memory"
}CPU에 부하를 주는 코드와 메모리에 부하를 주는 코드가 둘다 있는 서버다.
저러고 서버를 실행한 다음에, 메모리 할당을 유도해서 메모리 임계치에 이르면
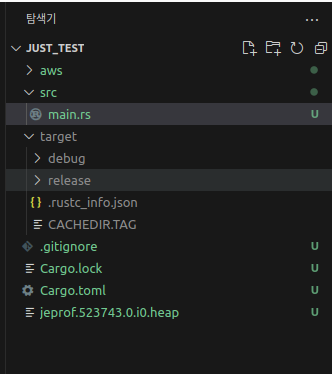 자동으로 덤프 파일을 이렇게 던진다.
저걸 갖다가 잘 지지고 볶으면 된다.
graphviz로 시각화하기
덤프 파일을 어떻게 눈으로 볼 수 있게 만들어보자.
다음 종속성들을 설치한다.
sudo apt-get install libjemalloc-dev graphviz -y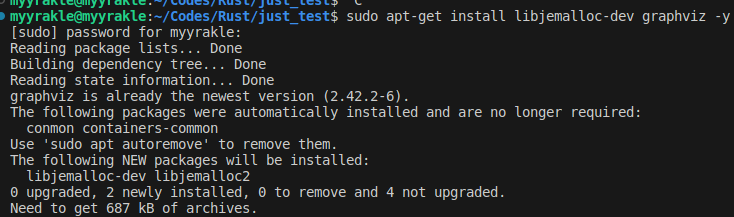
그러면 jeprof라는 도구가 깔리는데
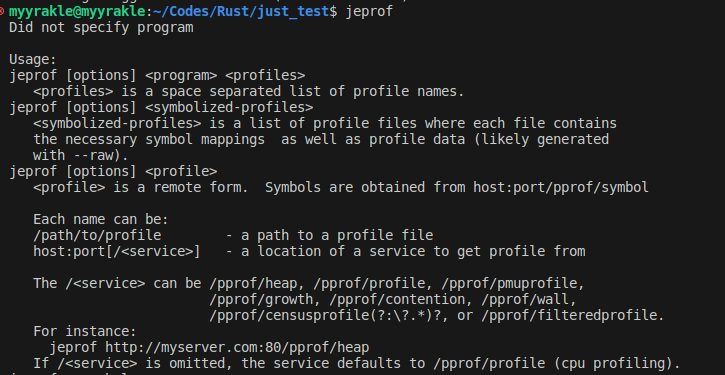
이걸 다음과 같은 형태로 실행한다.
jeprof --svg 실행파일 덤프파일 > heapdump.svg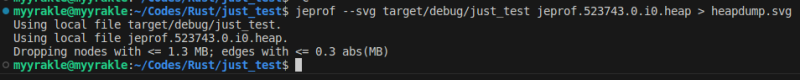 그러면 svg 파일이 생성이 되는데
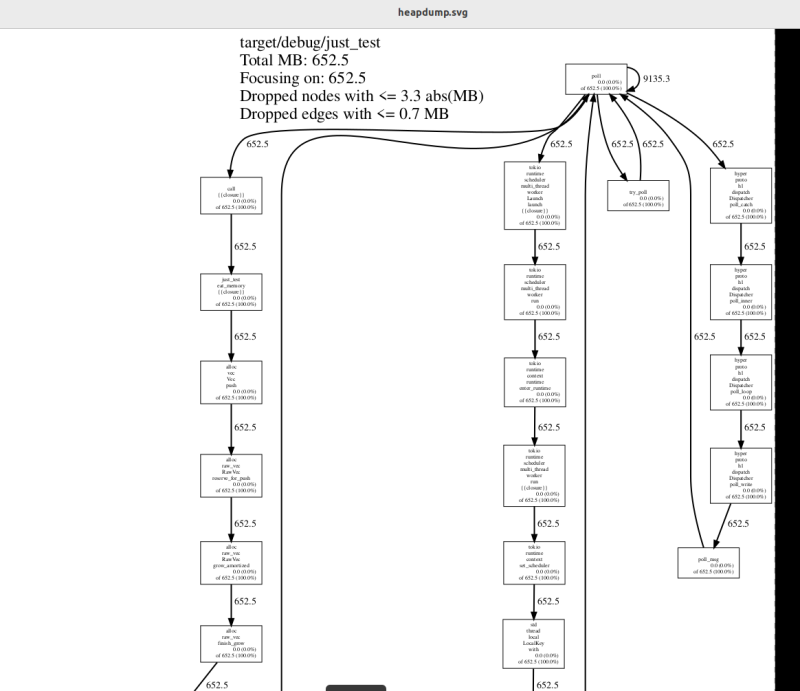 이걸 보고 따라가면 된다.
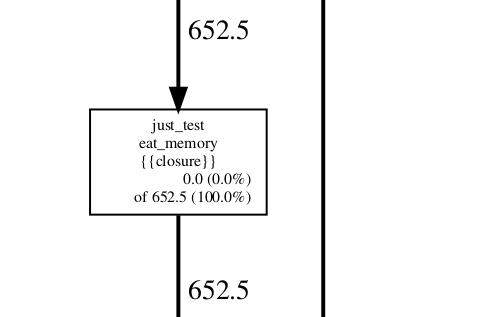 실제로 메모리를 많이도 쳐먹는 eat_memory 함수가 트레이스에 잡힌 것을 볼 수 있다.
prof 동적으로 껐다 켜기
근데 저 prof를 항상 켜놓는건 경우에 따라 성능적 손해가 될 수도 있다.
샘플링이 찰때마다 파일이 쌓이는 것도 그렇고, 이걸 켠 상태에서는 메모리 할당에 약간의 오버헤드가 생긴다.
물론 그 성능 저하가 심각한 편은 아니다. 최대 2% 정도라고 한다.
그래서 이건 선택의 문제다. Facebook의 경우에는 이런 옵션을 항상 켜둔다고 한다.
그래도 이 prof를 선택적으로 껐다 켜고 싶다면, 방법은 있다.
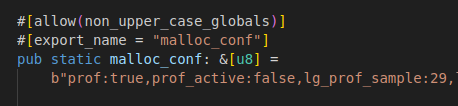 우선 prof_active 설정을 기본 false 값으로 깔아준다.
prof는 true여야 한다.
그리고 prof_active를 선택적으로 변경할 수 있도록 구현을 해주면 된다.
그러려면 내부 C 함수를 호출해야 하는데, 다행히 누가 래퍼를 좀 만들어둔게 있다.
jemalloc_pprof = "0.1.0"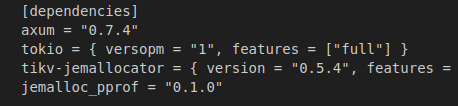 집어넣고
집어넣고
pub async fn enable_heap_debug() -> Result<impl IntoResponse, (StatusCode, String)> {
    let mut prof_ctl = jemalloc_pprof::PROF_CTL.as_ref().unwrap().lock().await;

    if prof_ctl.activated() {
        return Ok("heap profiling already activated");
    }

    prof_ctl
        .activate()
        .map_err(|err| (StatusCode::INTERNAL_SERVER_ERROR, err.to_string()))?;

    // 30초 동안만 활성화
    thread::sleep(std::time::Duration::from_secs(30));

    prof_ctl.deactivate().unwrap();

    Ok("heap profiling activated")
}
다음과 같이 제어 로직을 구현한다.
이 경우에는 API가 호출되면 30초 동안만 프로파일링이 활성화되도록 했다.
제어 스타일은 취향에 따라 선택하면 된다.
아래는 전체 코드다.
use std::thread;

use axum::{http::StatusCode, response::IntoResponse, routing::get, Router};

#[cfg(not(target_env = "msvc"))]
#[global_allocator]
static ALLOC: tikv_jemallocator::Jemalloc = tikv_jemallocator::Jemalloc;

#[allow(non_upper_case_globals)]
#[export_name = "malloc_conf"]
pub static malloc_conf: &[u8] =
    b"prof:true,prof_active:false,lg_prof_sample:29,lg_prof_interval:30\0";

#[tokio::main]
async fn main() {
    // build our application with a route
    let app = Router::new()
        .route("/", get(root))
        .route("/eat-cpu", get(eat_cpu))
        .route("/eat-memory", get(eat_memory))
        .route("/debug/heap/enable", axum::routing::get(enable_heap_debug));

    // run our app with hyper, listening globally on port 3000
    let listener = tokio::net::TcpListener::bind("0.0.0.0:3000").await.unwrap();
    axum::serve(listener, app).await.unwrap();
}

// basic handler that responds with a static string
async fn root() -> &'static str {
    "Hello, World!"
}

async fn eat_cpu() -> &'static str {
    let mut hash_set = std::collections::HashSet::new();

    for i in 0..1000000 {
        hash_set.insert(i);
    }

    "cpu"
}

async fn eat_memory() -> &'static str {
    let mut v: Vec<i32> = Vec::new();

    // 200mb of memory
    for i in 0..50_000_000 {
        v.push(i);
    }

    "memory"
}

pub async fn enable_heap_debug() -> Result<impl IntoResponse, (StatusCode, String)> {
    let mut prof_ctl = jemalloc_pprof::PROF_CTL.as_ref().unwrap().lock().await;

    if prof_ctl.activated() {
        return Ok("heap profiling already activated");
    }

    prof_ctl
        .activate()
        .map_err(|err| (StatusCode::INTERNAL_SERVER_ERROR, err.to_string()))?;

    // 30초 동안만 활성화
    thread::sleep(std::time::Duration::from_secs(30));

    prof_ctl.deactivate().unwrap();

    Ok("heap profiling activated")
}
이러면 enable 함수가 실행중이지 않을 때는 프로파일링이 수행되지 않고, 성능에도 아무런 지장이 없을 것이다.
참조
https://www.polarsignals.com/blog/posts/2023/12/20/rust-memory-profiling
https://www.magiroux.com/rust-jemalloc-profiling/