[Grafana Tempo] API 기본
이번엔 그냥 대시보드랑 sdk로 대충 끼우는거 말고, 직접 HTTP API 쏴보면서 구조를 파악해보자.
https://grafana.com/docs/tempo/latest/api_docs/
구성은 docker compose 기반이다.
이게 tempo.yml이고
stream_over_http_enabled: true
server:
  http_listen_port: 3200
  log_level: info

query_frontend:
  search:
    duration_slo: 5s
    throughput_bytes_slo: 1.073741824e+09
    metadata_slo:
      duration_slo: 5s
      throughput_bytes_slo: 1.073741824e+09
  trace_by_id:
    duration_slo: 5s
  metrics:
    max_duration: 120h
    query_backend_after: 5m
    duration_slo: 5s
    throughput_bytes_slo: 1.073741824e+09

distributor:
  receivers:
    otlp:
      protocols:
        http:
          endpoint: "0.0.0.0:4318"
        grpc:
          endpoint: "0.0.0.0:4317"

ingester:
  max_block_duration: 5m # cut the headblock when this much time passes. this is being set for demo purposes and should probably be left alone normally

compactor:
  compaction:
    block_retention: 168h

metrics_generator:
  registry:
    external_labels:
      source: tempo
      cluster: docker-compose
  storage:
    path: /var/tempo/generator/wal
  traces_storage:
    path: /var/tempo/generator/traces

storage:
  trace:
    backend: local # backend configuration to use
    wal:
      path: /var/tempo/wal # where to store the wal locally
    local:
      path: /var/tempo/blocks

overrides:
  defaults:
    metrics_generator:
      processors: [service-graphs, span-metrics, local-blocks] # enables metrics generator
      generate_native_histograms: both
이게 docker-compose.yml이다.
services:
tempo:
image: grafana/tempo:2.7.1
ports:
- "3200:3200"
command: ["-config.file=/etc/tempo.yaml"]
volumes:
- tempo_data:/var/tempo
- ./tempo.yaml:/etc/tempo.yaml
volumes:
tempo_data:
driver: local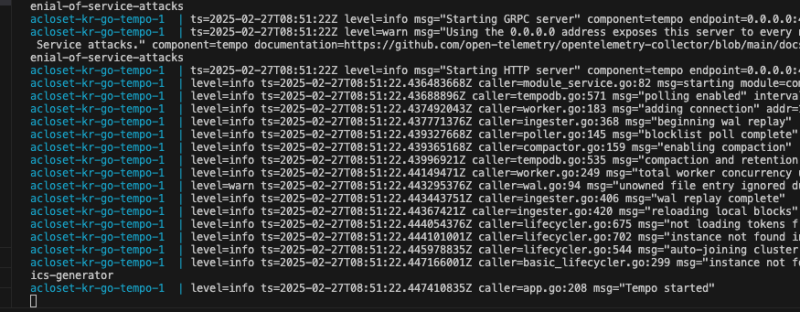 실행한다.
실행한다.
3200 포트로 Tempo 서버를, 4318 포트로 open telemetry 호환 서버를 열었다.
상태 확인
기본적으로 Tempo에 직접 읽기를 쏘는 것은 3200 포트를 사용한다.
curl -X GET http://localhost:3200/status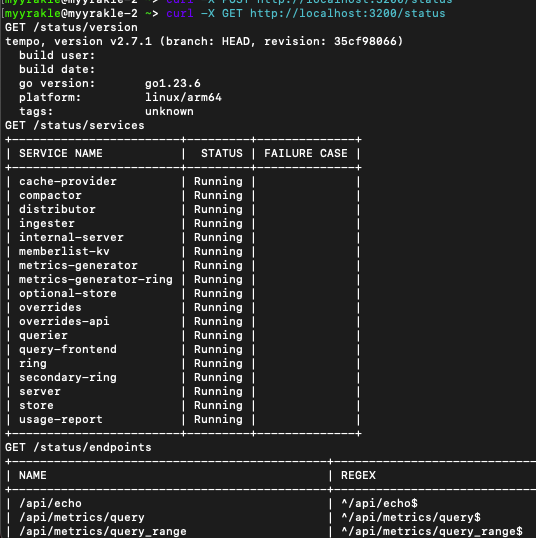 그럼 이렇게 상태 정보나 api 목록같은게 뜬다.
trace 삽입하기
데이터를 집어넣을 때는 oltp 호환 엔드포인트를 통해 찔러야 한다.
이렇게 넣으면 된다.
curl -X POST http://localhost:4318/v1/traces \
-H "Content-Type: application/json" \
-d '{
"resourceSpans": [{
"resource": {
"attributes": [{
"key": "service.name",
"value": { "stringValue": "test-service" }
}]
},
"scopeSpans": [{
"spans": [{
"traceId": "5b8aa5a2d2c872e8321cf37308d69df2",
"spanId": "5fb397be34d25d8b",
"name": "test-span",
"kind": 1,
"startTimeUnixNano": "1644238522000000000",
"endTimeUnixNano": "1644238522000000000"
}]
}]
}]
}'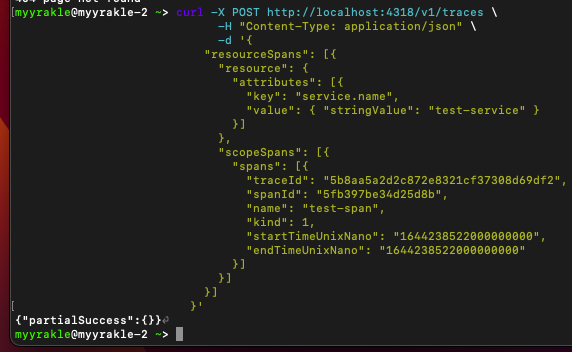 이렇게 뜨면 잘 된 것이다.
scopeSpans에 있는게 기본적인 span 필드 값들이다.
kind가 서버인지 consumer인지 구분하는 enum 정수값이고, resource.attribute가 부가적인 태그값들이다.
단순 조회
traceID 기반의 상세 조회는 그냥 trace ID를 path parameter로 채워서 쏘면 된다.
curl -X GET http://localhost:3200/api/traces/5b8aa5a2d2c872e8321cf37308d69df2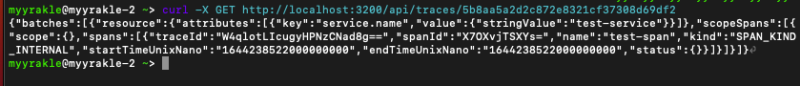
search API를 쓰면 태그값들을 기반으로 필터해서 가져올 수도 있다.
curl -X GET "http://localhost:3200/api/search?tags=service.name%3Dtest-service"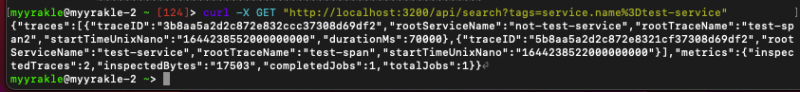
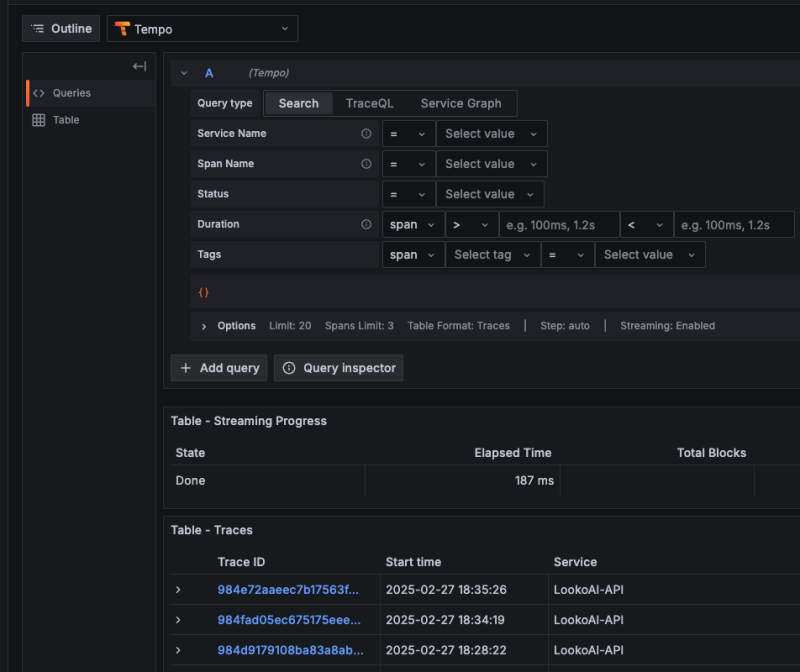
grafana에서도 explorer 탭에서 이 search 기능을 시각화된 형태로 사용할 수 있다.
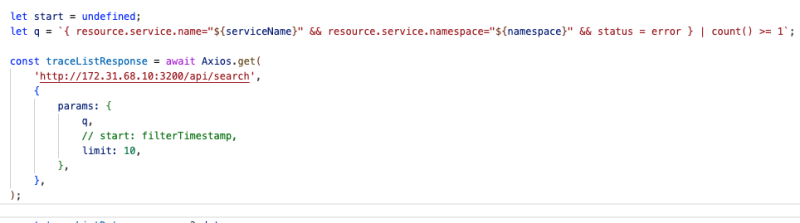
근데 이런 방식은 좀 불편하기도 하고, 보통 traceQL이라는 확장 구문을 통해서 Grafana에서 직접 쏘는 형태로 자주 쓴다.
q라는 파라미터에 TraceQL 표현식을 담아서 쏘면 거기 맞춰서 뿌려준다.
 TraceQL의 문법과 사용법은 다음 포스트에서 다뤄본다.
참조
https://grafana.com/docs/tempo/latest/api_docs/
https://grafana.com/docs/tempo/latest/api_docs/pushing-spans-with-http/