[k8s] Prometheus: AlertManager로 Slack 경보 구성
서비스 운영에서 가장 중요한 것중 하나는, 서버에서 장애가 발생했을때 빠르게 알아차리는 것이다.
Pod가 OOM으로 죽거나, Node에 문제가 생기거나, 리소스 사용량이 급격이 증가한다면, 그걸 빠르게 알아야 장애로 인한 위험을 최소화하고 조치를 할 수 있기 때문이다. 서비스의 품질에 매우 중요한 영향을 끼치는 부분이다.
AWS 같은 클라우드에서는 Cloudwatch를 비롯한 전용 시스템으로 Alert를 지원하지만, k8s 스택에서는 당연히도 직접 다 구성해줘야 한다.
여기서는 거의 표준으로 여겨지는 Prometheus의 AlertManager를 쓴다고 가정하겠다.
AlertManager를는 Prometheus의 세부 스택 중 하나이고, Prometheus 팀에서 관리한다.
이걸 쓰는 가장 간단한 방법은 kube-prometheus-stack 패키지를 깔아서 설치하는 것이다.
안에 AlertManager가 내장되어있다.
https://blog.naver.com/sssang97/224176325746
목표
대부분의 개발 조직에서는 아마 Slack을 메인 소통 채널로 사용할 것이다.
따라서 여기서는 서버가 죽거나 node가 offline상태가 된 경우, 혹은 node에 taint가 붙은 경우에 Slack으로 전송할 수 있도록 구성해보겠다.
Slack App 준비
Slack 서비스에 들어가서 Bot App을 만들고, 그 앱의 토큰과 알림을 전송할 채널의 ID를 준비한다.
자세한 방법은 별도 포스트를 참조한다.
https://blog.naver.com/sssang97/223176628812
AlertManager 환경설정 (with helm)
helm으로 설치한 경우가 아니라면 세팅이 좀 불편하다. helm을 쓴다고 가정하겠다.
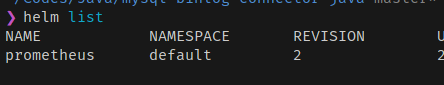
먼저 helm으로 설치된 prometheus stack의 이름과 네임스페이스를 알아낸다.
그리고 다음과 같이 Slack App의 토큰과 전송할 채널 등을 helm values로 정의한다.
alertmanager:
  config:
    global:
      slack_api_url: "https://slack.com/api/chat.postMessage"

    route:
      group_by: ["alertname", "cluster", "namespace"]
      group_wait: 10s # 첫 알림 대기
      group_interval: 10s # 그룹에 새 알림 추가 대기
      repeat_interval: 12h # 같은 알림 반복 간격
      receiver: "slack-critical"

      routes:
        # Critical 알림
        - match:
            severity: critical
          receiver: "slack-critical"
          continue: true

        # Warning 알림
        - match:
            severity: warning
          receiver: "slack-warnings"

    receivers:
      # Critical 알림 (즉시)
      - name: "slack-critical"
        slack_configs:
          - channel: "채널 ID"
            title: '{{ if eq .Status "firing" }}🔴 Critical Alert{{ else }}✅ Resolved: Critical Alert{{ end }}'
            text: |-
              <!here>
              {{ if eq .Status "resolved" }}*Status:* RESOLVED{{ end }}
              *Alert:* {{ .GroupLabels.alertname }}
              *Severity:* {{ .CommonLabels.severity }}
              *Summary:* {{ .CommonAnnotations.summary }}
              *Description:* {{ .CommonAnnotations.description }}
            send_resolved: true
            http_config:
              authorization:
                credentials: "SLACK 토큰"

      # Warning 알림
      - name: "slack-warnings"
        slack_configs:
          - channel: "채널 ID"
            title: '{{ if eq .Status "firing" }}⚠️ Warning{{ else }}✅ Resolved: Warning{{ end }}'
            text: |-
              {{ if eq .Status "resolved" }}*Status:* RESOLVED{{ end }}
              *Alert:* {{ .GroupLabels.alertname }}
              *Namespace:* {{ .CommonLabels.namespace }}
              *Pod:* {{ .CommonLabels.pod }}
              *Description:* {{ .CommonAnnotations.description }}
            send_resolved: true
            http_config:
              authorization:
                credentials: "SLACK 토큰"
그리고 저걸 가져다가 helm으로 update를 적용한다.
helm upgrade prometheus prometheus-community/kube-prometheus-stack \
--reuse-values \
-f alertmanager-values.yaml \
--namespace default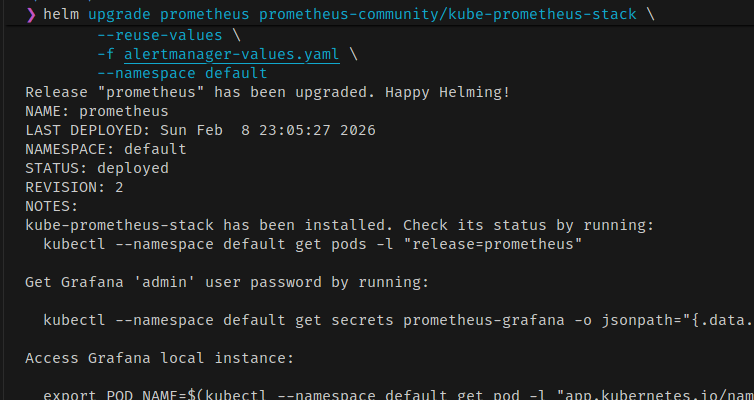 오류 없이 적용된다면 대충 된 것이다.
Rule 정의
위에서 helm으로 채널과 인증 정보를 정의했다면, 실제 Alert 동작과 조건을 정의하는 것은 Rule을 통해서 이루어진다. PrometheusRule라는 CRD를 통해서 리소스를 정의할 수 있다.
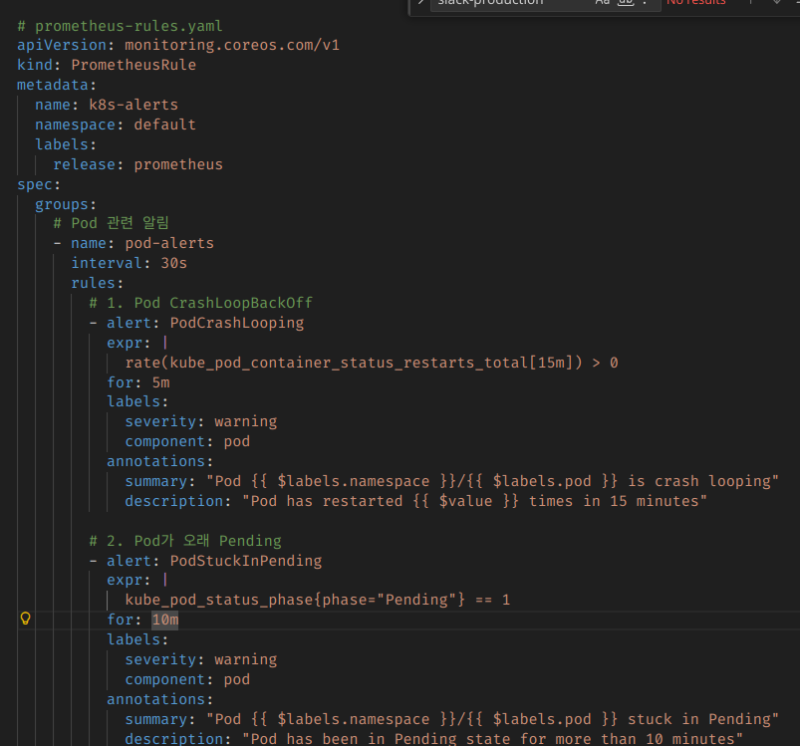
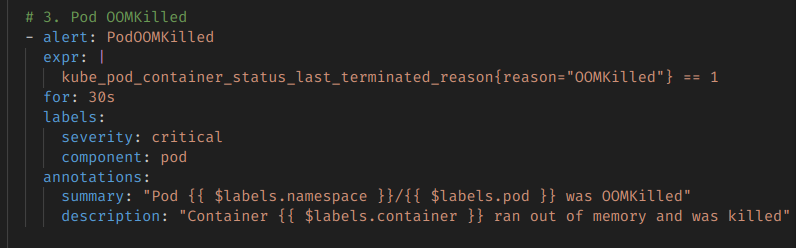 이런 식으로, 프로메테우스에 기록되는 메트릭 정보를 기반으로 해서 Alert를 날리는 것이다.
아까 정의했던 severity에 따라서 실제 채널에 전송이 된다.
예제 코드는 좀 커서 Github을 통해 첨부한다.
https://github.com/myyrakle/infrastructures/blob/master/k8s/setups/alert-manager/rules-example.yaml
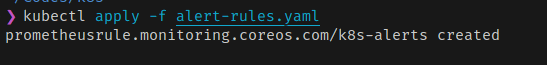
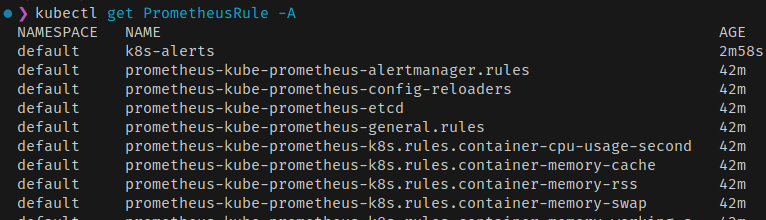
아무튼 잘 작성해서 생성하고
혹시나 모르니 Reload를 한번 해주자. 이게 실시간으로 잘 적용되는건 아니더라.
kubectl exec -n default prometheus-prometheus-kube-prometheus-prometheus-0 -c prometheus -- wget --post-data="" -qO- 'http://localhost:9090/-/reload' 2>/dev/null && echo "Reload triggered" && sleep 5Alert 실험해보기 (OOM)
이제 Alert가 동작하는지를 확인해보자.
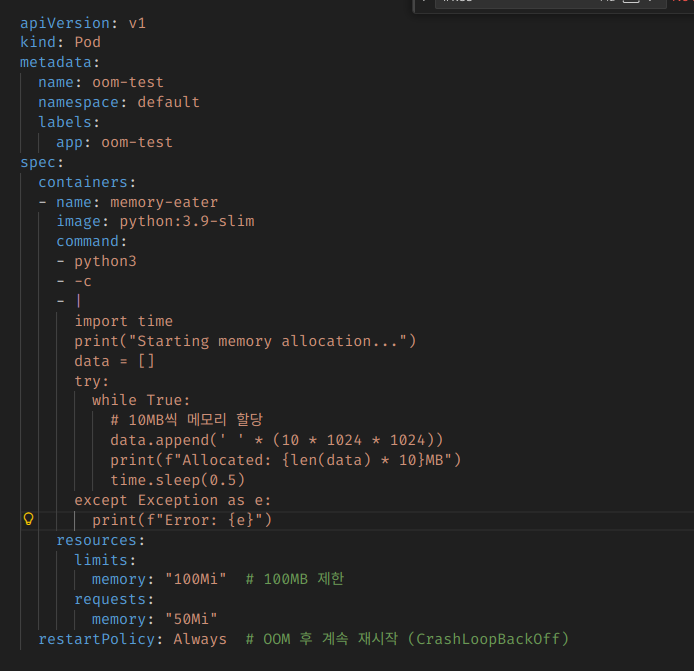
메모리 먹고 OOM으로 자살하는 Pod를 하나 정의해봤다.
apiVersion: v1
kind: Pod
metadata:
name: oom-test
namespace: default
labels:
app: oom-test
spec:
containers:
- name: memory-eater
image: python:3.9-slim
command:
- python3
- -c
- |
import time
print("Starting memory allocation...")
data = []
try:
while True:
# 10MB씩 메모리 할당
data.append(' ' * (10 * 1024 * 1024))
print(f"Allocated: {len(data) * 10}MB")
time.sleep(0.5)
except Exception as e:
print(f"Error: {e}")
resources:
limits:
memory: "100Mi" # 100MB 제한
requests:
memory: "50Mi"
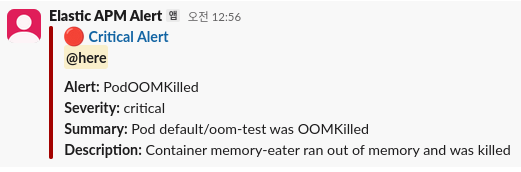
restartPolicy: Always # OOM 후 계속 재시작 (CrashLoopBackOff)그리고 실행해보면, 당연히 OOM으로 죽을 것이고
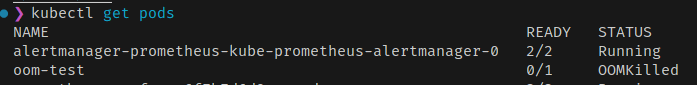
Slack 알림도 날라올 것이다.
위험이 해소되는 것도 확인해보자.
OOM이 나지 않도록 변경하고
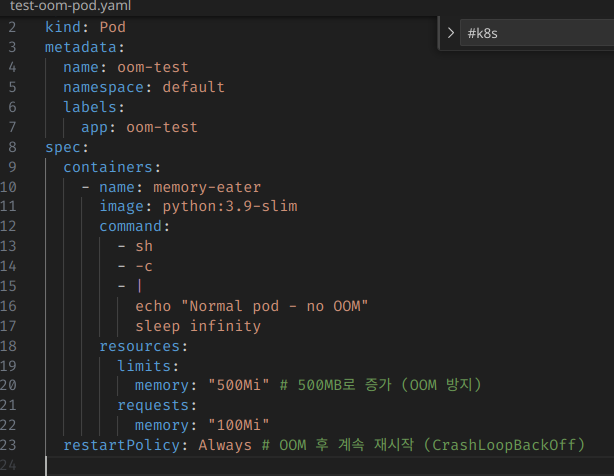
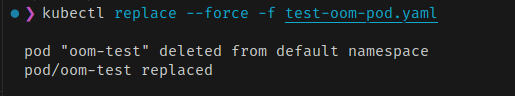 재부팅해준다.
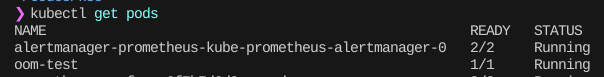 오류가 없는 상태로 좀 지속이 되면
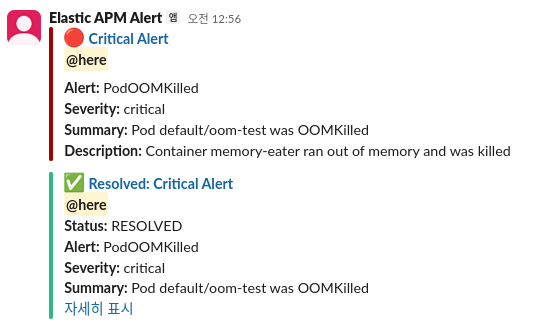 그때는 이제 resolved 메시지가 날라올 것이다.
참조
https://prometheus.io/docs/alerting/latest/alertmanager/
https://medium.com/@hyukjuner/kubernetes%EC%97%90-%EB%B0%B0%ED%8F%AC%EB%90%9C-prometheus-alertmanager%EC%9D%98-%EA%B5%AC%EC%84%B1-%EC%9D%B4%ED%95%B4-0fda19076ab9